August 2023- May 2024 | Contract

The Town of University Park

Homeowner Sustainability Scorecard

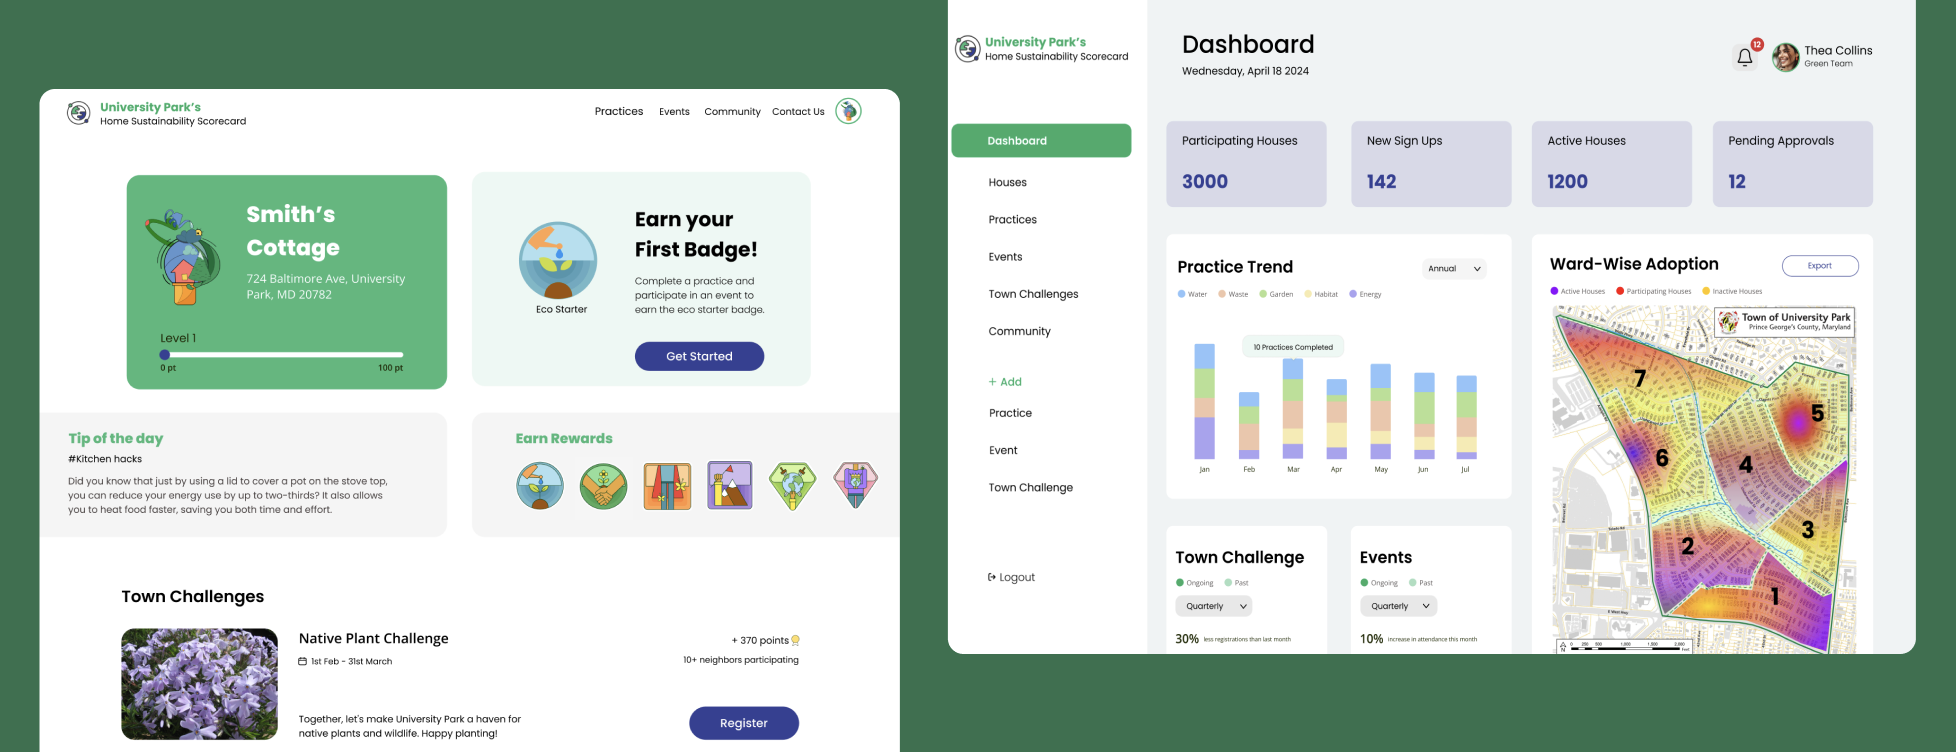
A one-of-a-kind web platform designed for University Park homeowners to track and enhance their sustainability efforts and build a community, while enabling admins to visualize the impact effectively.

Approved, funded, and currently in the developer selection phase.

Role
1/5 Product Designers
  • Led UX Research, Information Architecture, UI Design, and Dev Documentation
  • Participated in every stage of the design process

There is no good answer to the question most homeowners eventually ask: what can I do to make my home more sustainable, and where do I even start?

University Park's sustainability committee had one. A scoring system that ranked residents against each other based on the sustainable practices they adopted. Competitive, measurable, and logical on paper. They brought our team in to design it.

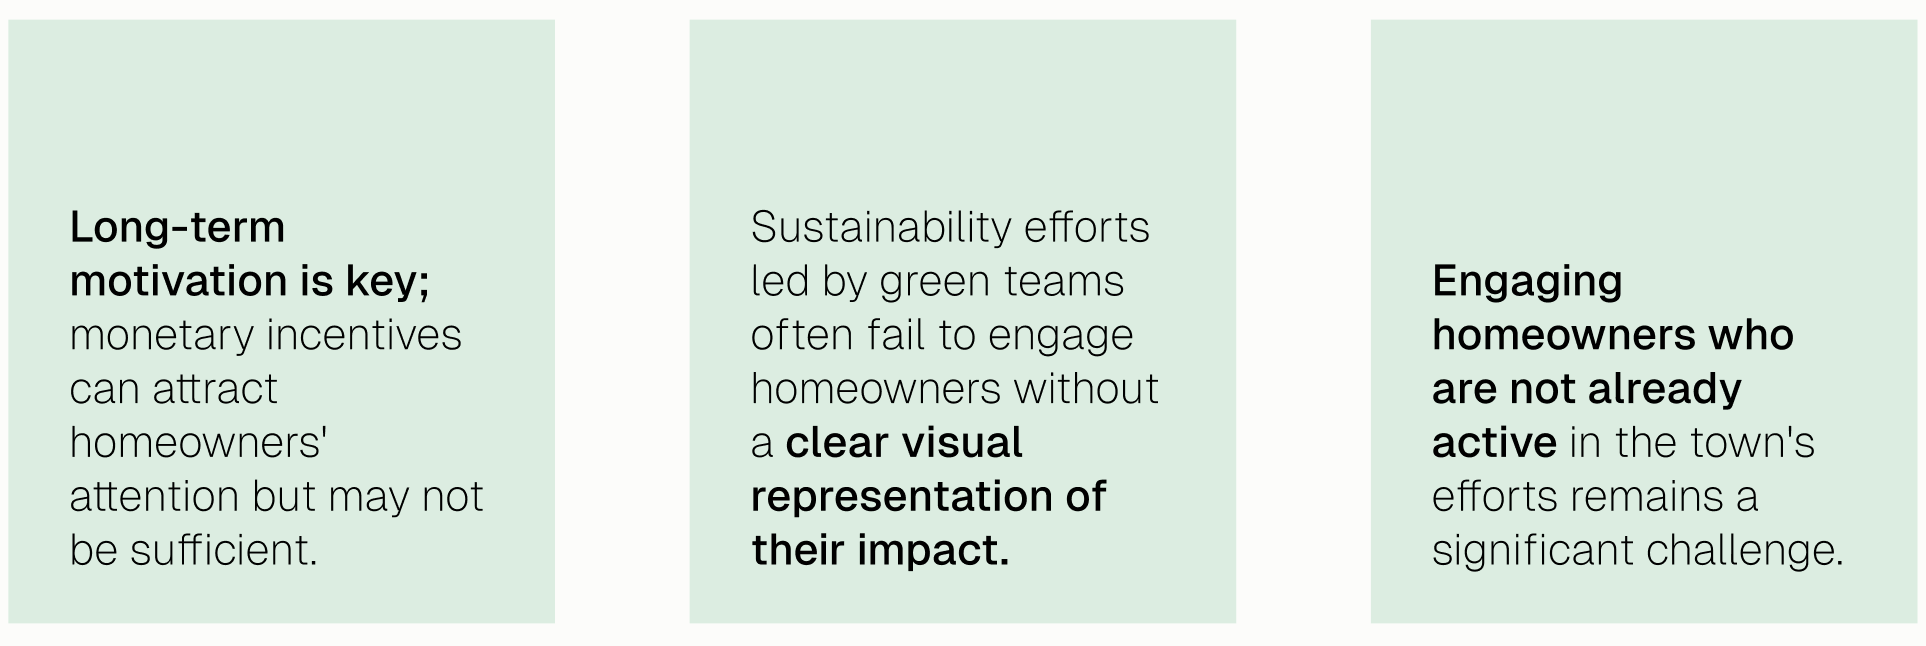
The research told a different story. Homeowners didn't need to be ranked. They needed access to information, motivation, and a sense that their efforts were part of something bigger.

So we redesigned the brief.

And we designed a system that would

Provide access to sustainability practices and necessary resources for homeowners.
Encourage voluntary commitment to long-term sustainability actions.
Foster a community spirit of mutual learning.
Enable the sustainability committee to monitor town-wide progress effectively.

Our Process Began With

Literature Review and Market Analysis

How is the rest of the world approaching sustainability?
Built a dataset of closely related solutions and a comprehensive list of practices from all over the world, categorizing them by effort and location.
What makes sense for UPark?
Visualized practices based on the grants and rebates that were available to UPark homeowners but we had to talk to experts to understand if this approach would work.
We then conducted
Expert Interviews and Field Research

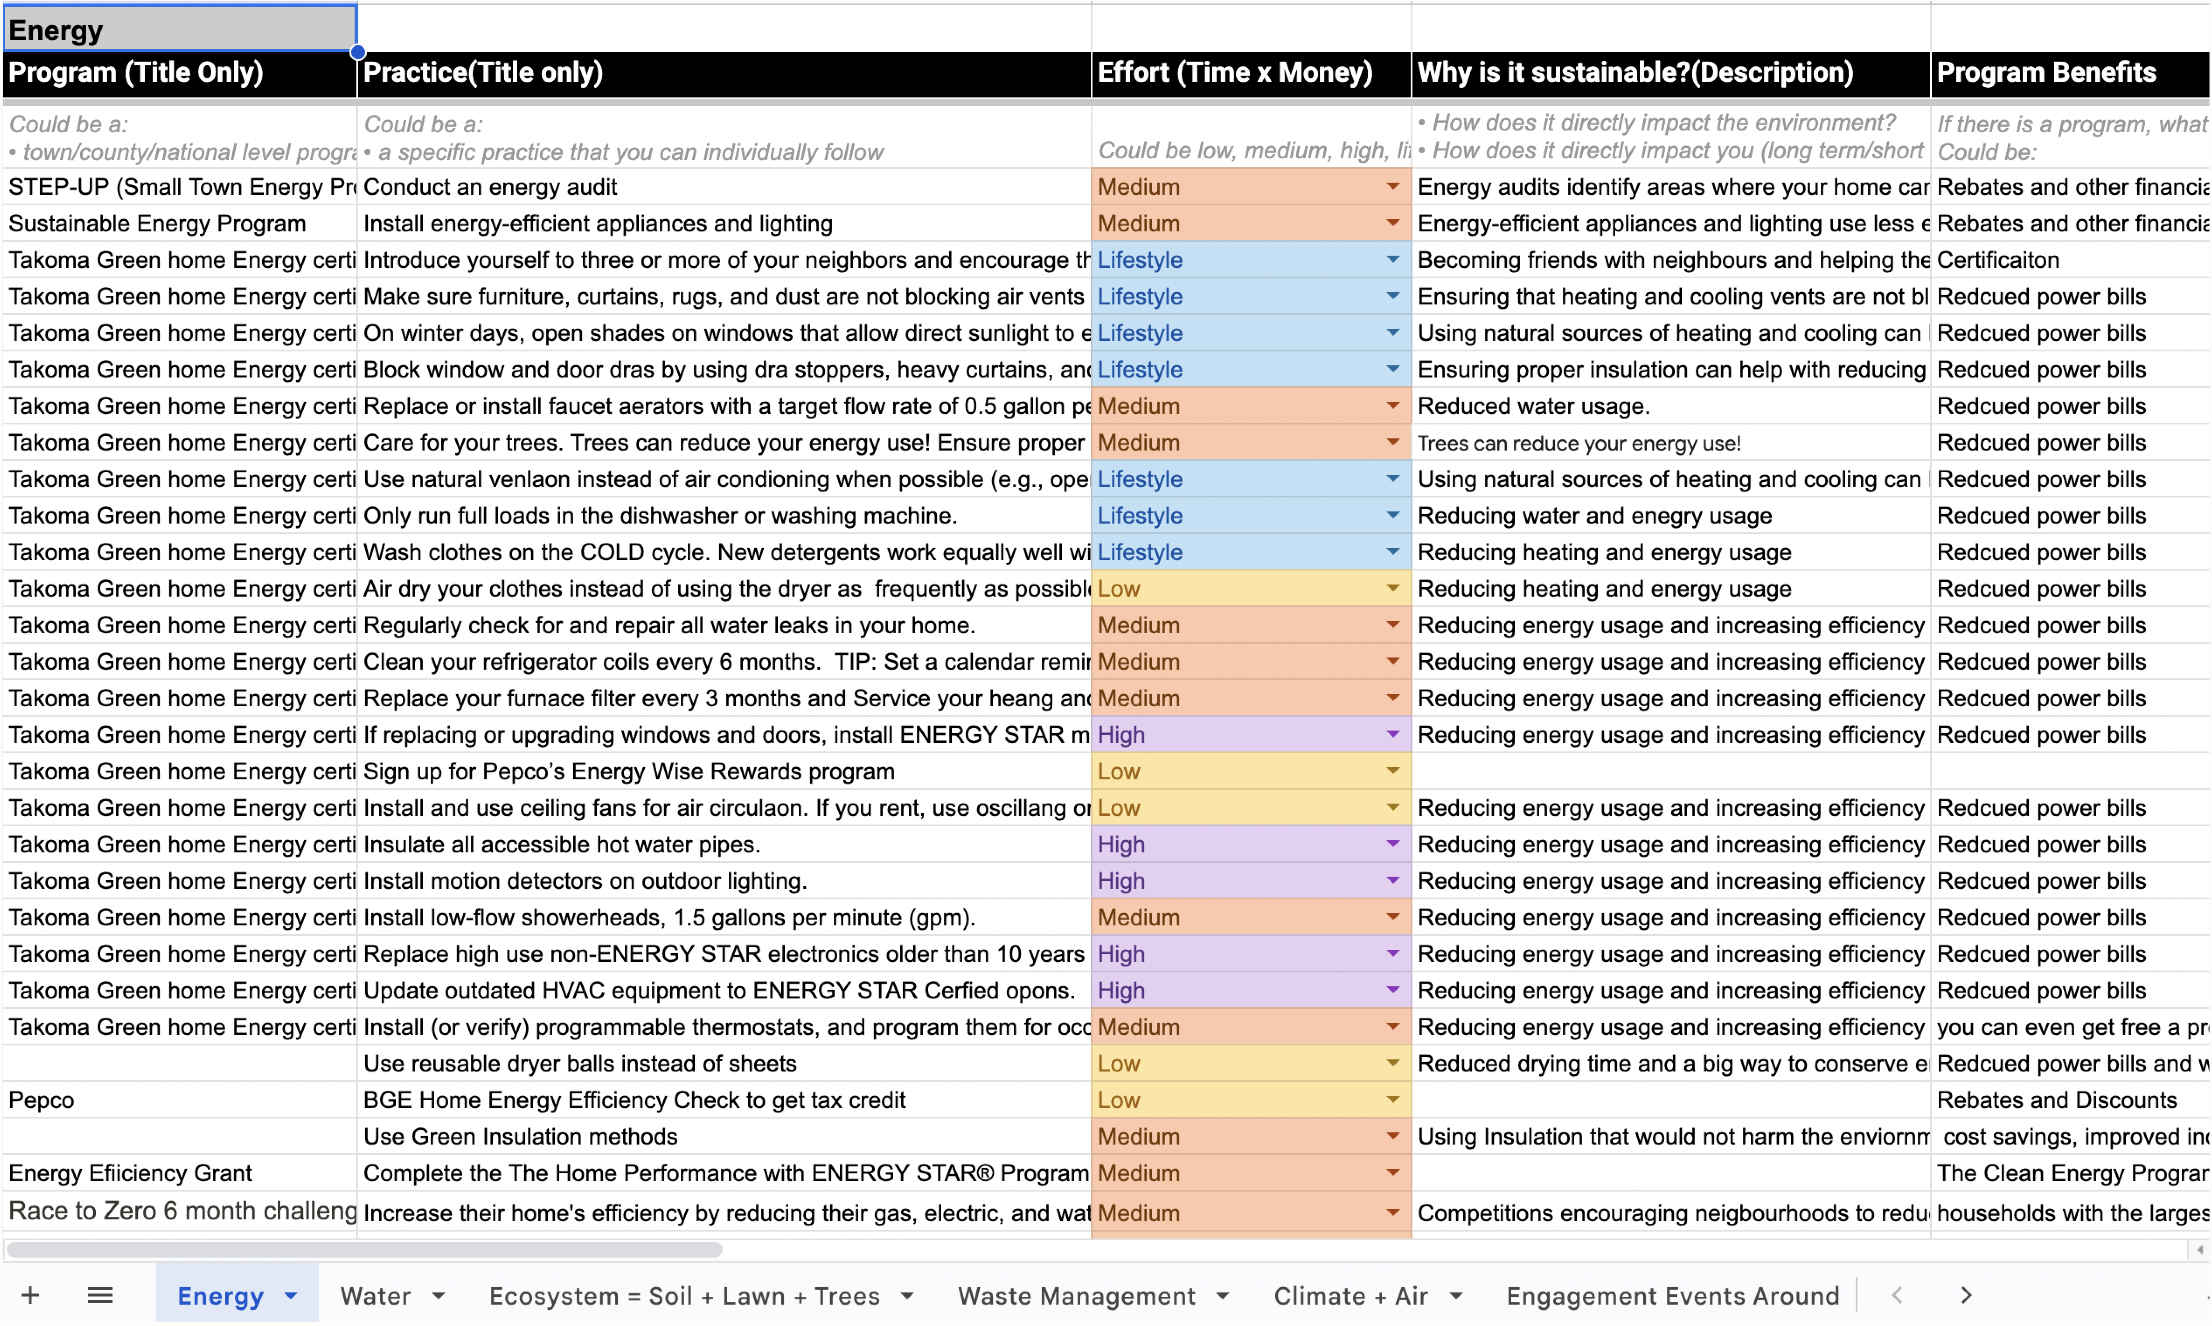
We visited city halls in neighboring towns and cities and spoke with sustainability leads to understand their approaches—what worked well and what didn't. We also interviewed homeowners with varying levels of sustainability awareness to hear their thoughts on effective strategies and areas needing improvement.

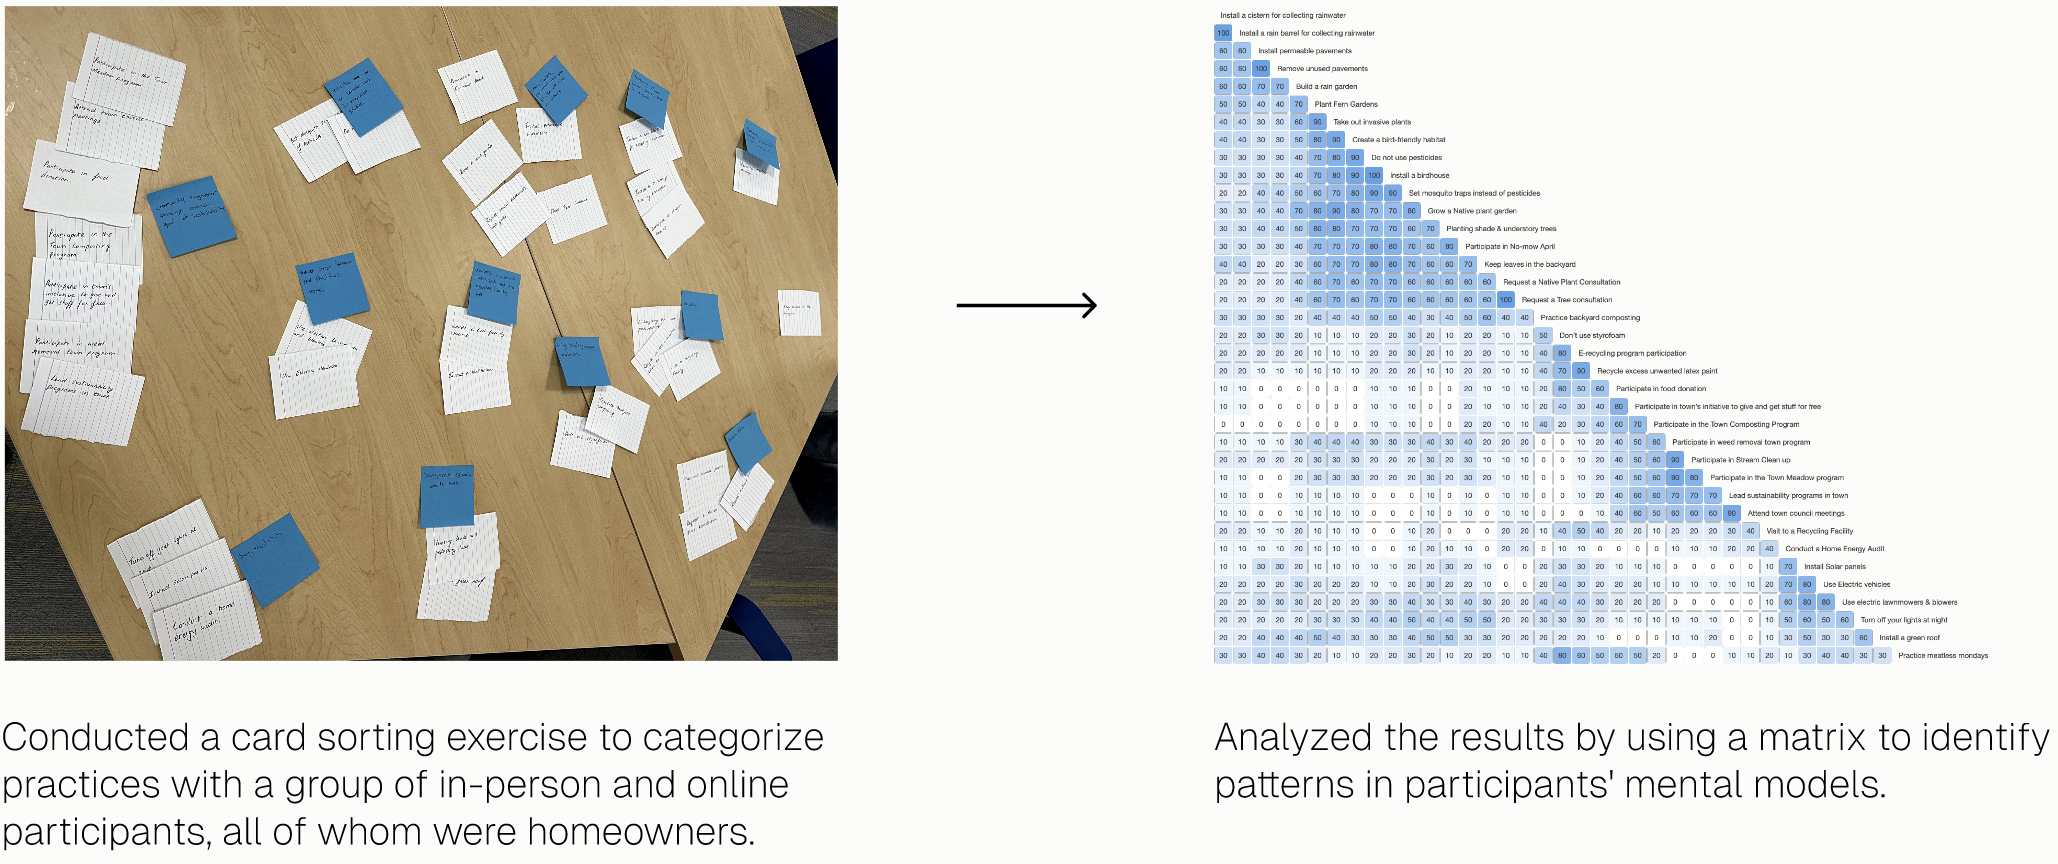
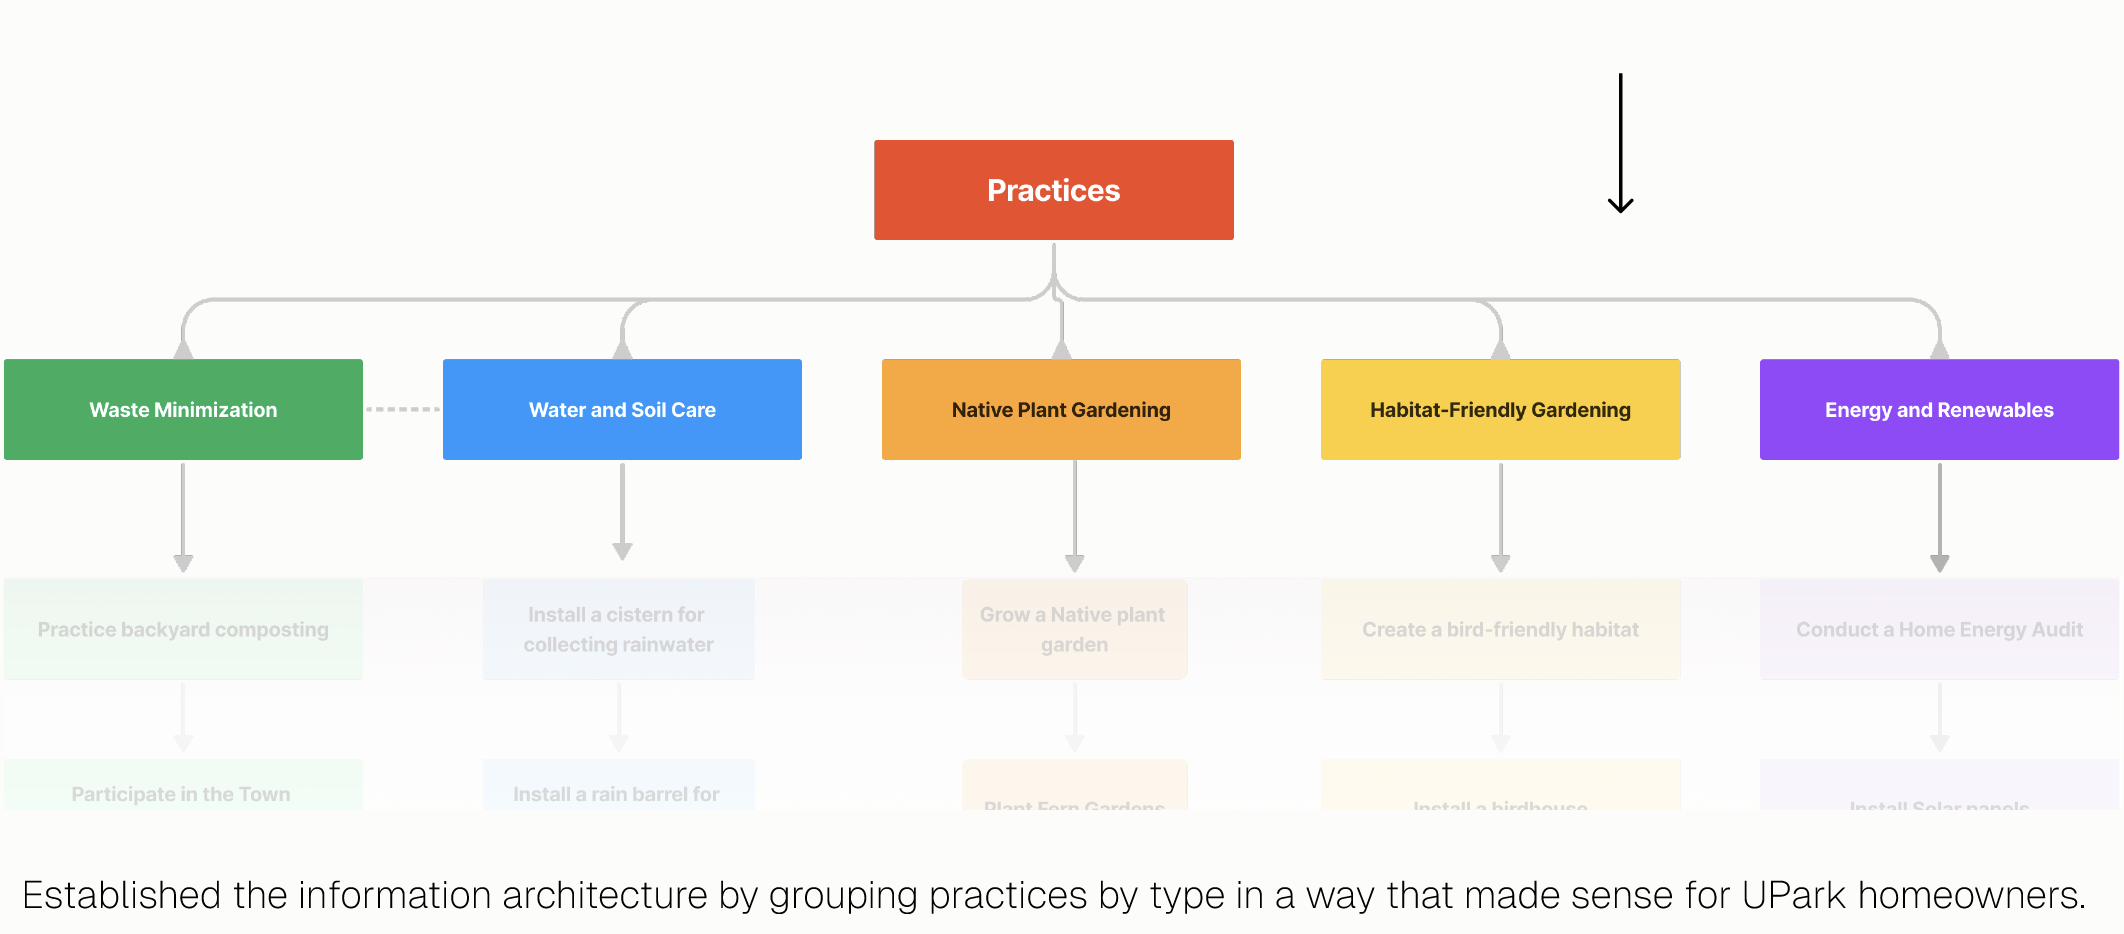
Here's what we found out:

Which led us to
Uncovering User Perspectives
In parallel, we set out to establish the
Information Architecture For Practices
Once we understood whom we were designing for, we moved on to crafting a
Proof Of Concept
Once the core features were established, we moved on to
Identifying the Motivators
How do we visualize progress and ensure users are motivated to complete more practices?
By introducing just the right amount of gamification!
We formulated multiple strategies and tested edge cases to ensure we get this right which resulted in:
How do we build an active community that shares information and brings people together?
We introduced a community page where people can publicly discuss all things sustainable and share their experiences with practices and events, encouraging community engagement.
Once the user facing part of the portal came together, we designed an
Agile Backend Framework
Monitor resident activity
By introducing proof of submission mechanisms that make the approval process easier for residents and the sustainability committee.
Maintain the platform
With a content management system, each page can be modified by the sustainability committee, allowing them to add new challenges, events, and practices.
Granular Data Exploration
Admins can delve into each dataset to gain a deeper understanding of resident activity, enabling them to direct their efforts more effectively.

Five designers. Five completely different visual directions. Here's how we got to one.

Establishing a Design System
When we started working on the design direction, we let our creativity run wild in the best way possible, resulting in five completely different ideas. Despite our strikingly different mood boards and concept boards, we came together to set a cohesive tone for the platform by designing multiple versions of the base pages and preference testing our designs with proxy users before finalizing the design system.
Once our screens for the core user flows were designed, we began
Testing our Design

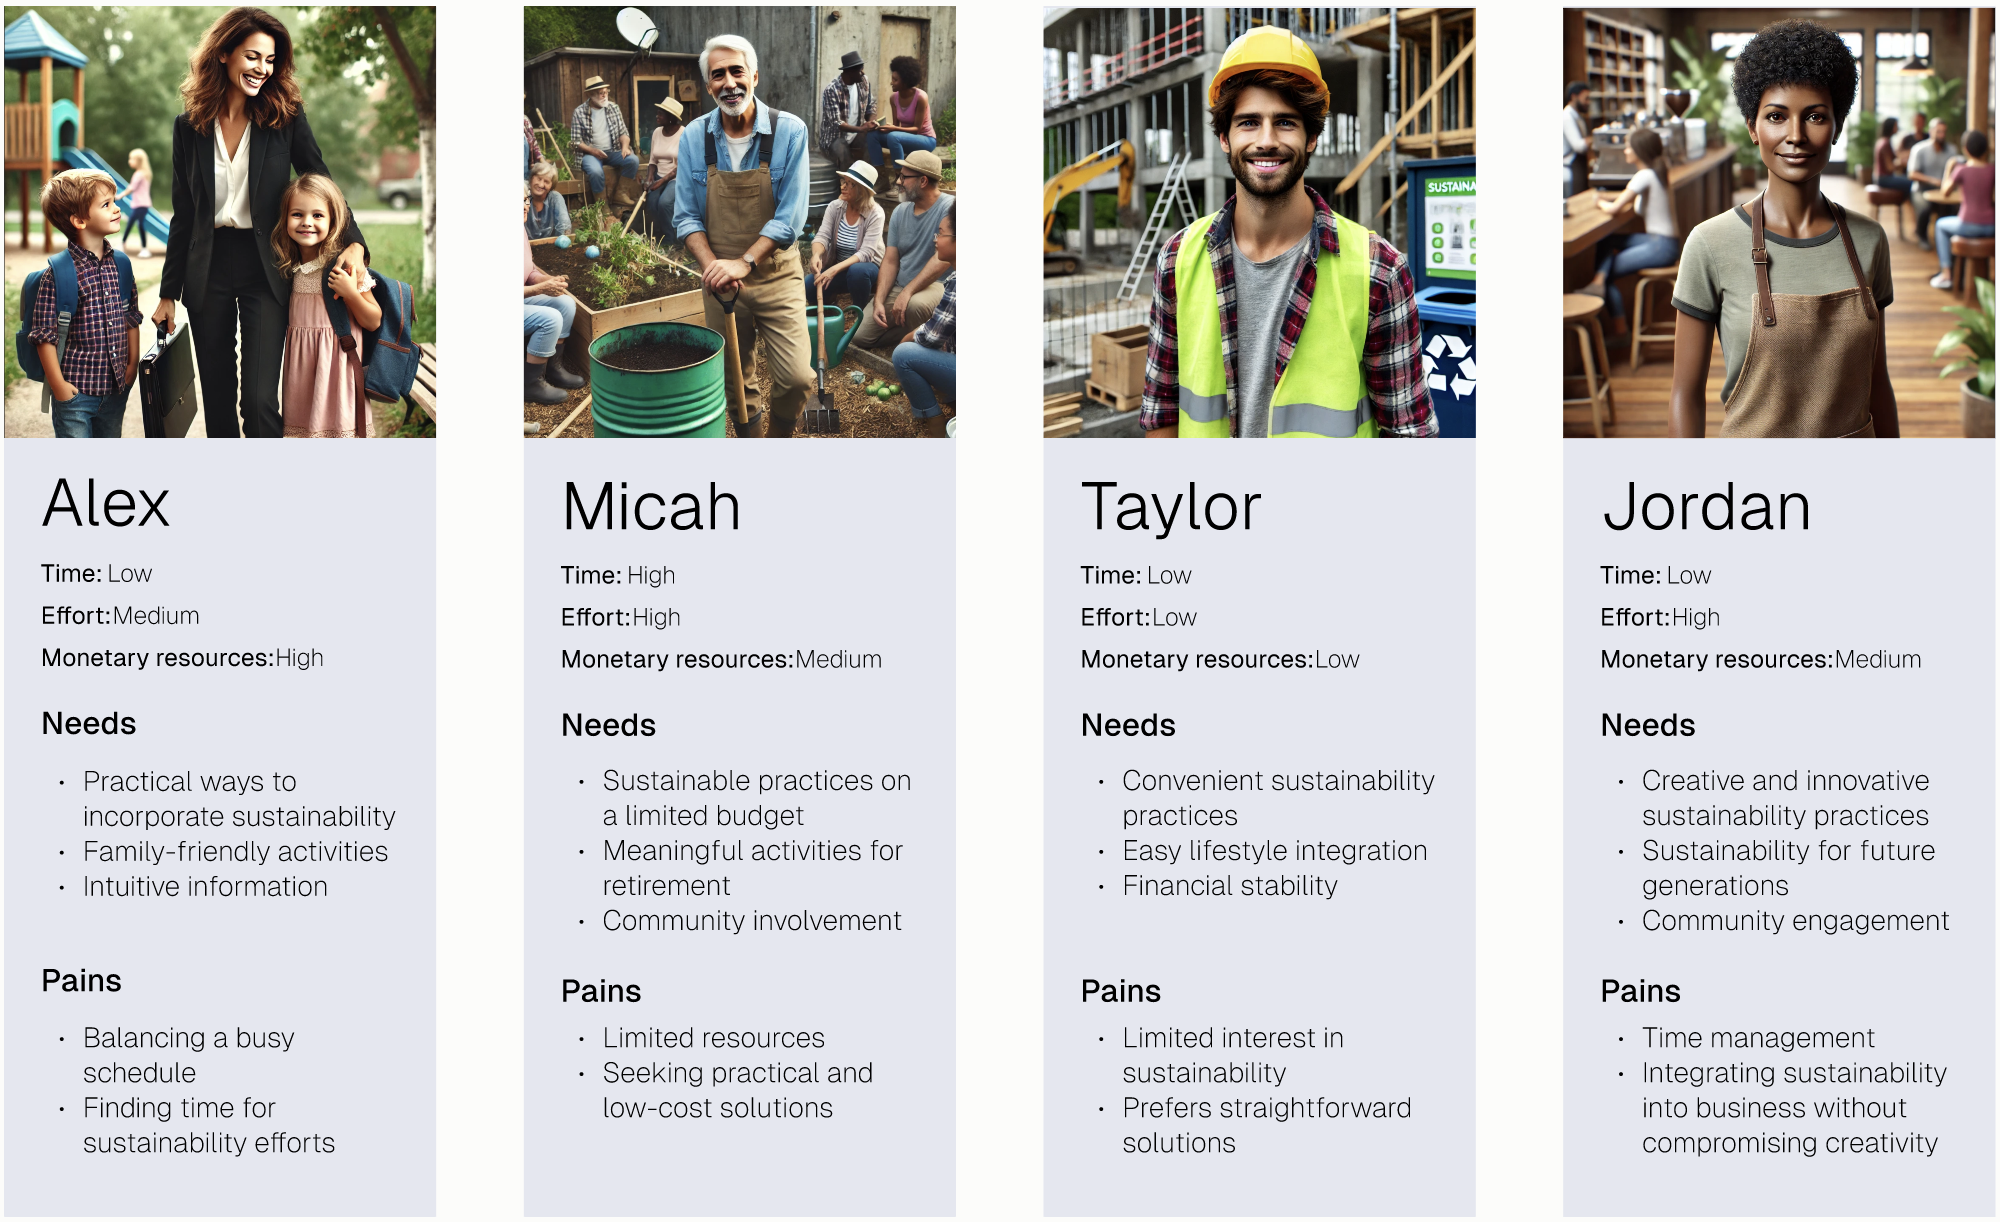
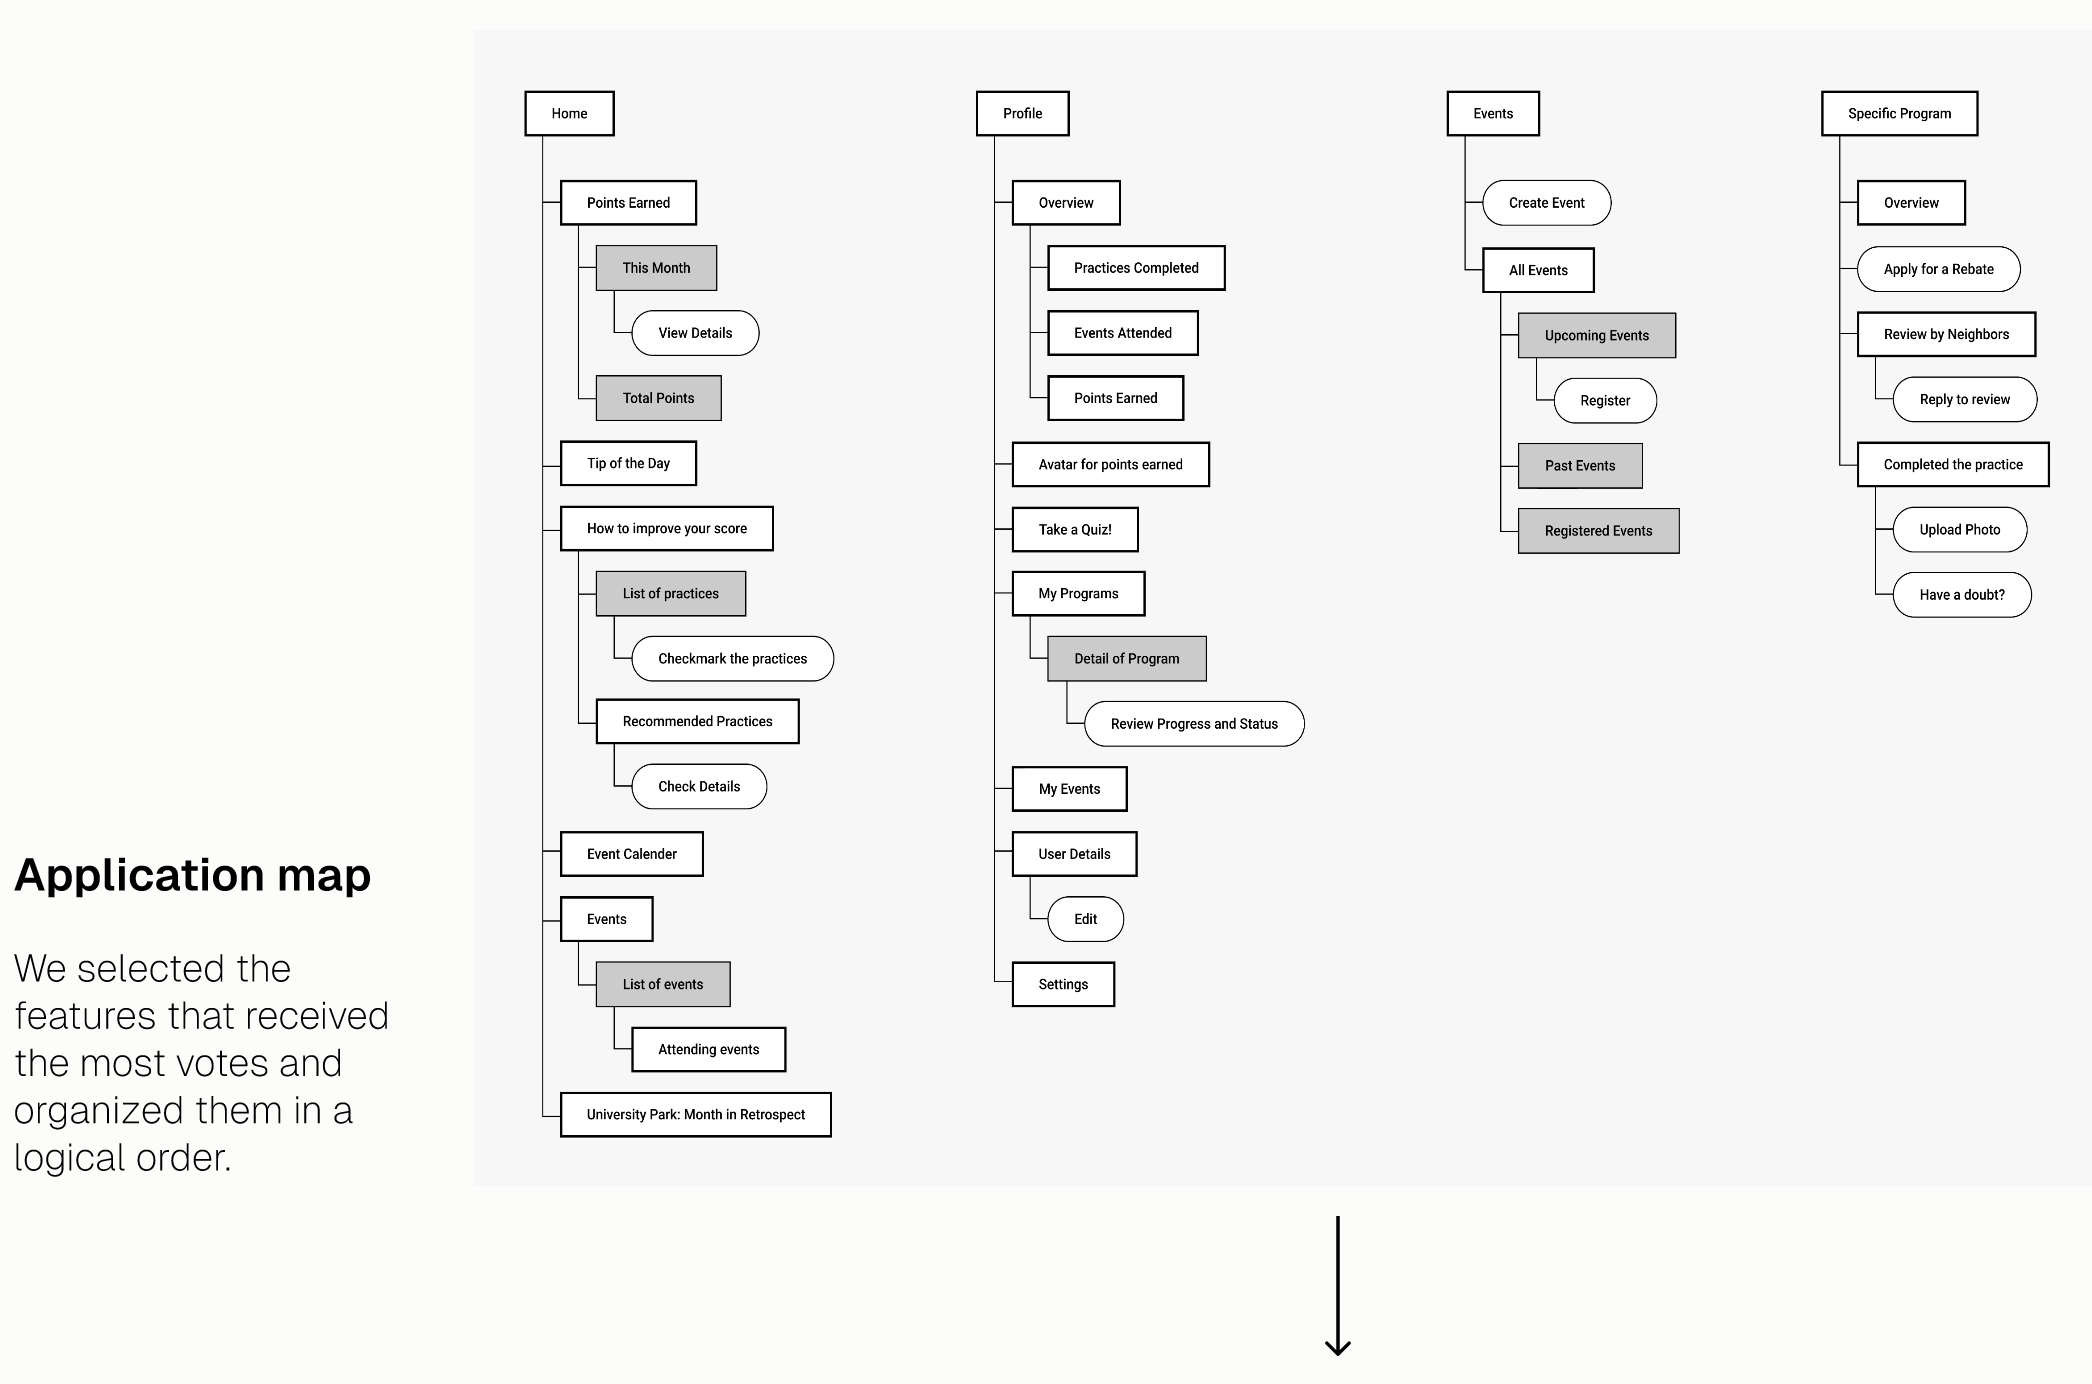
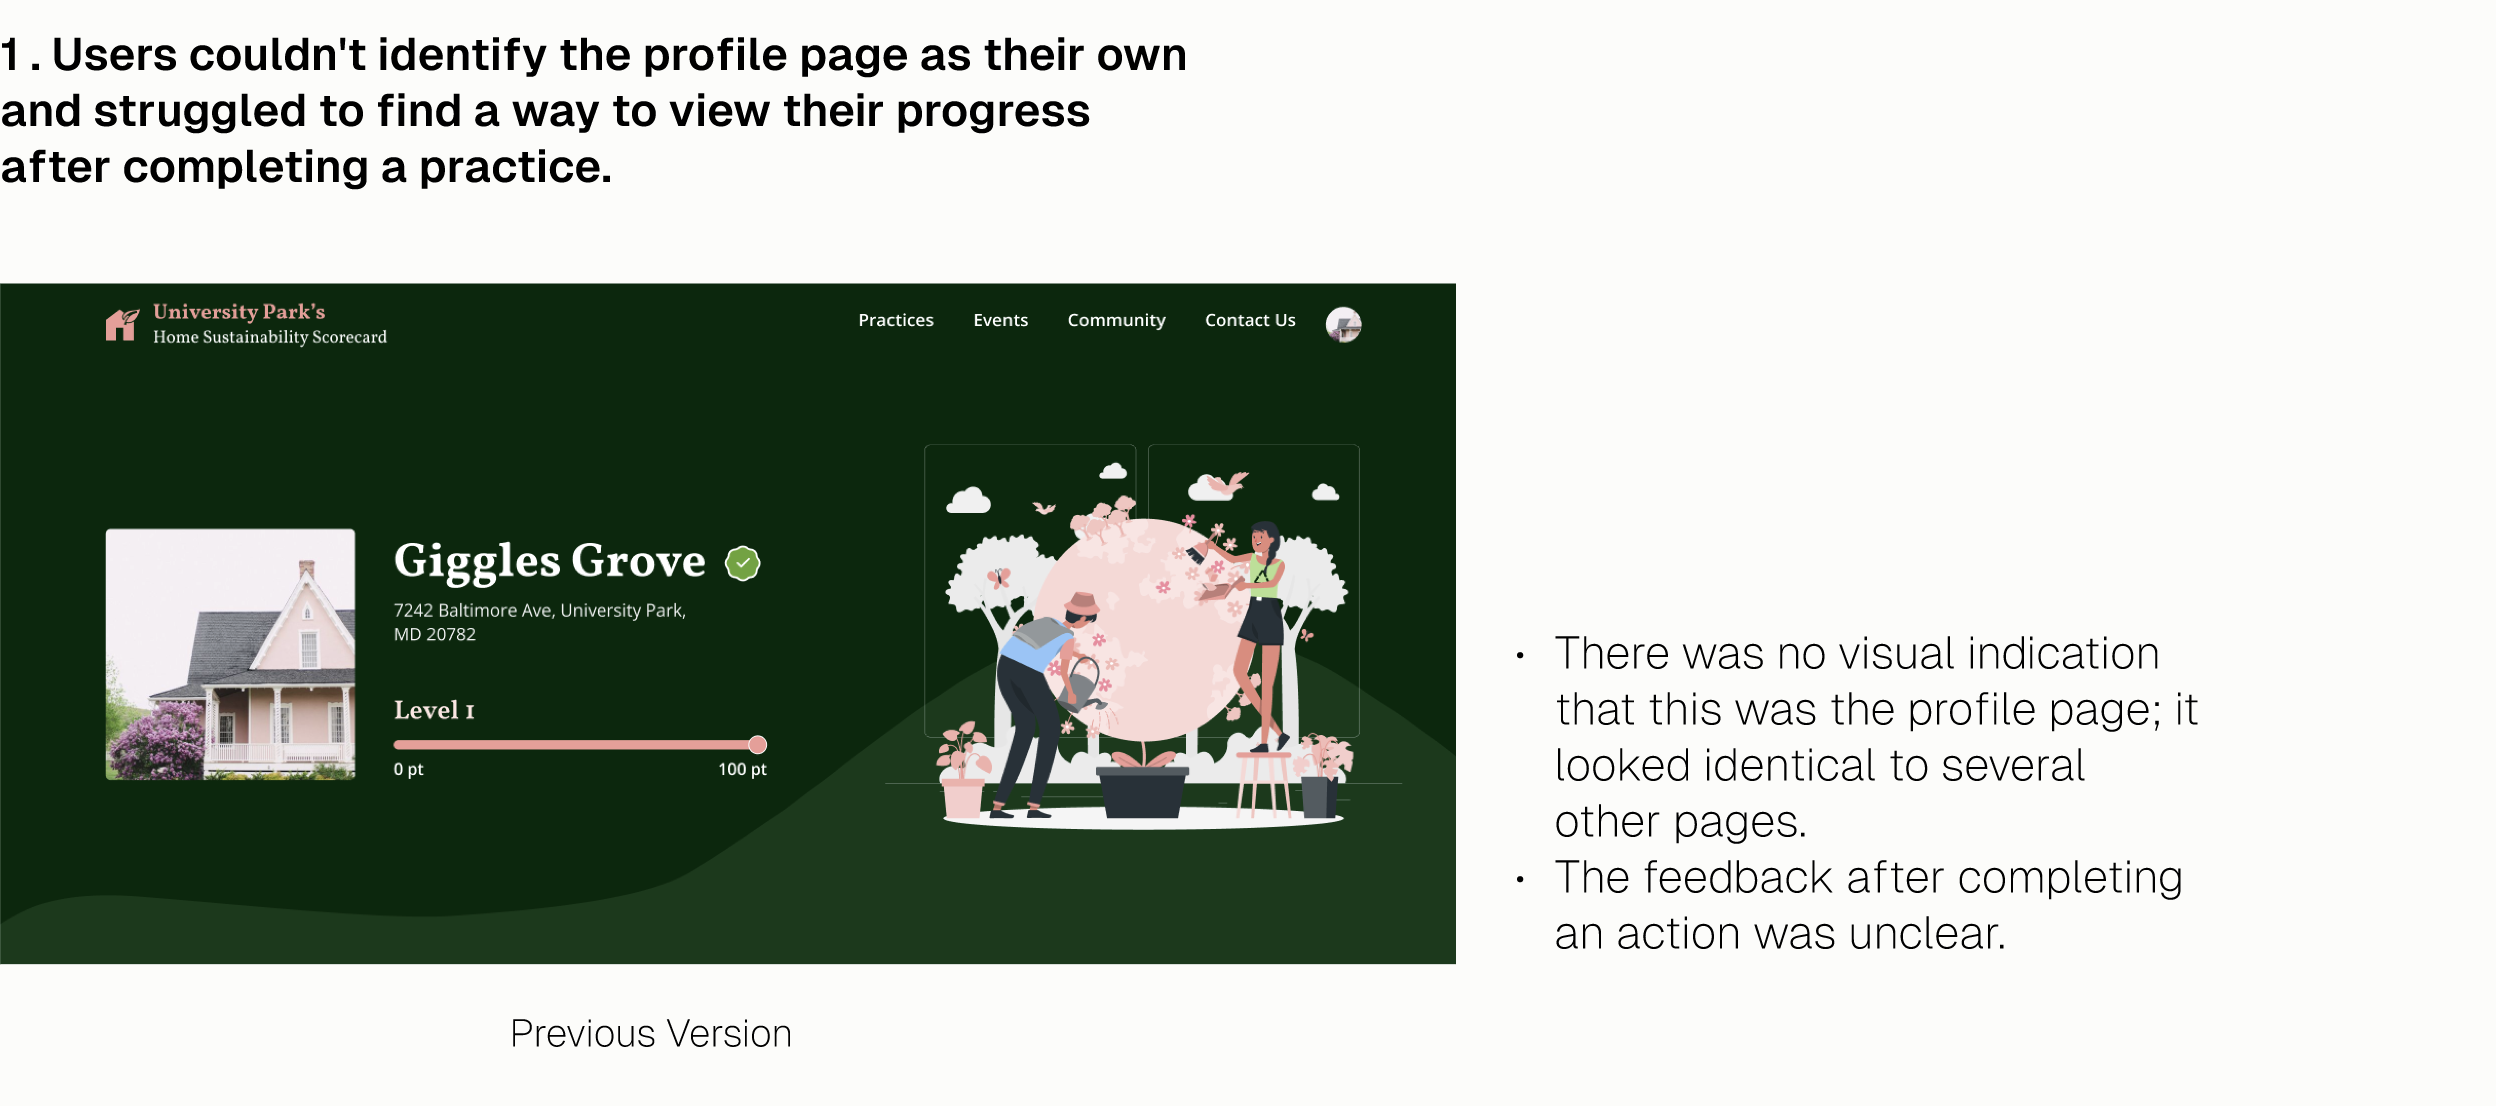
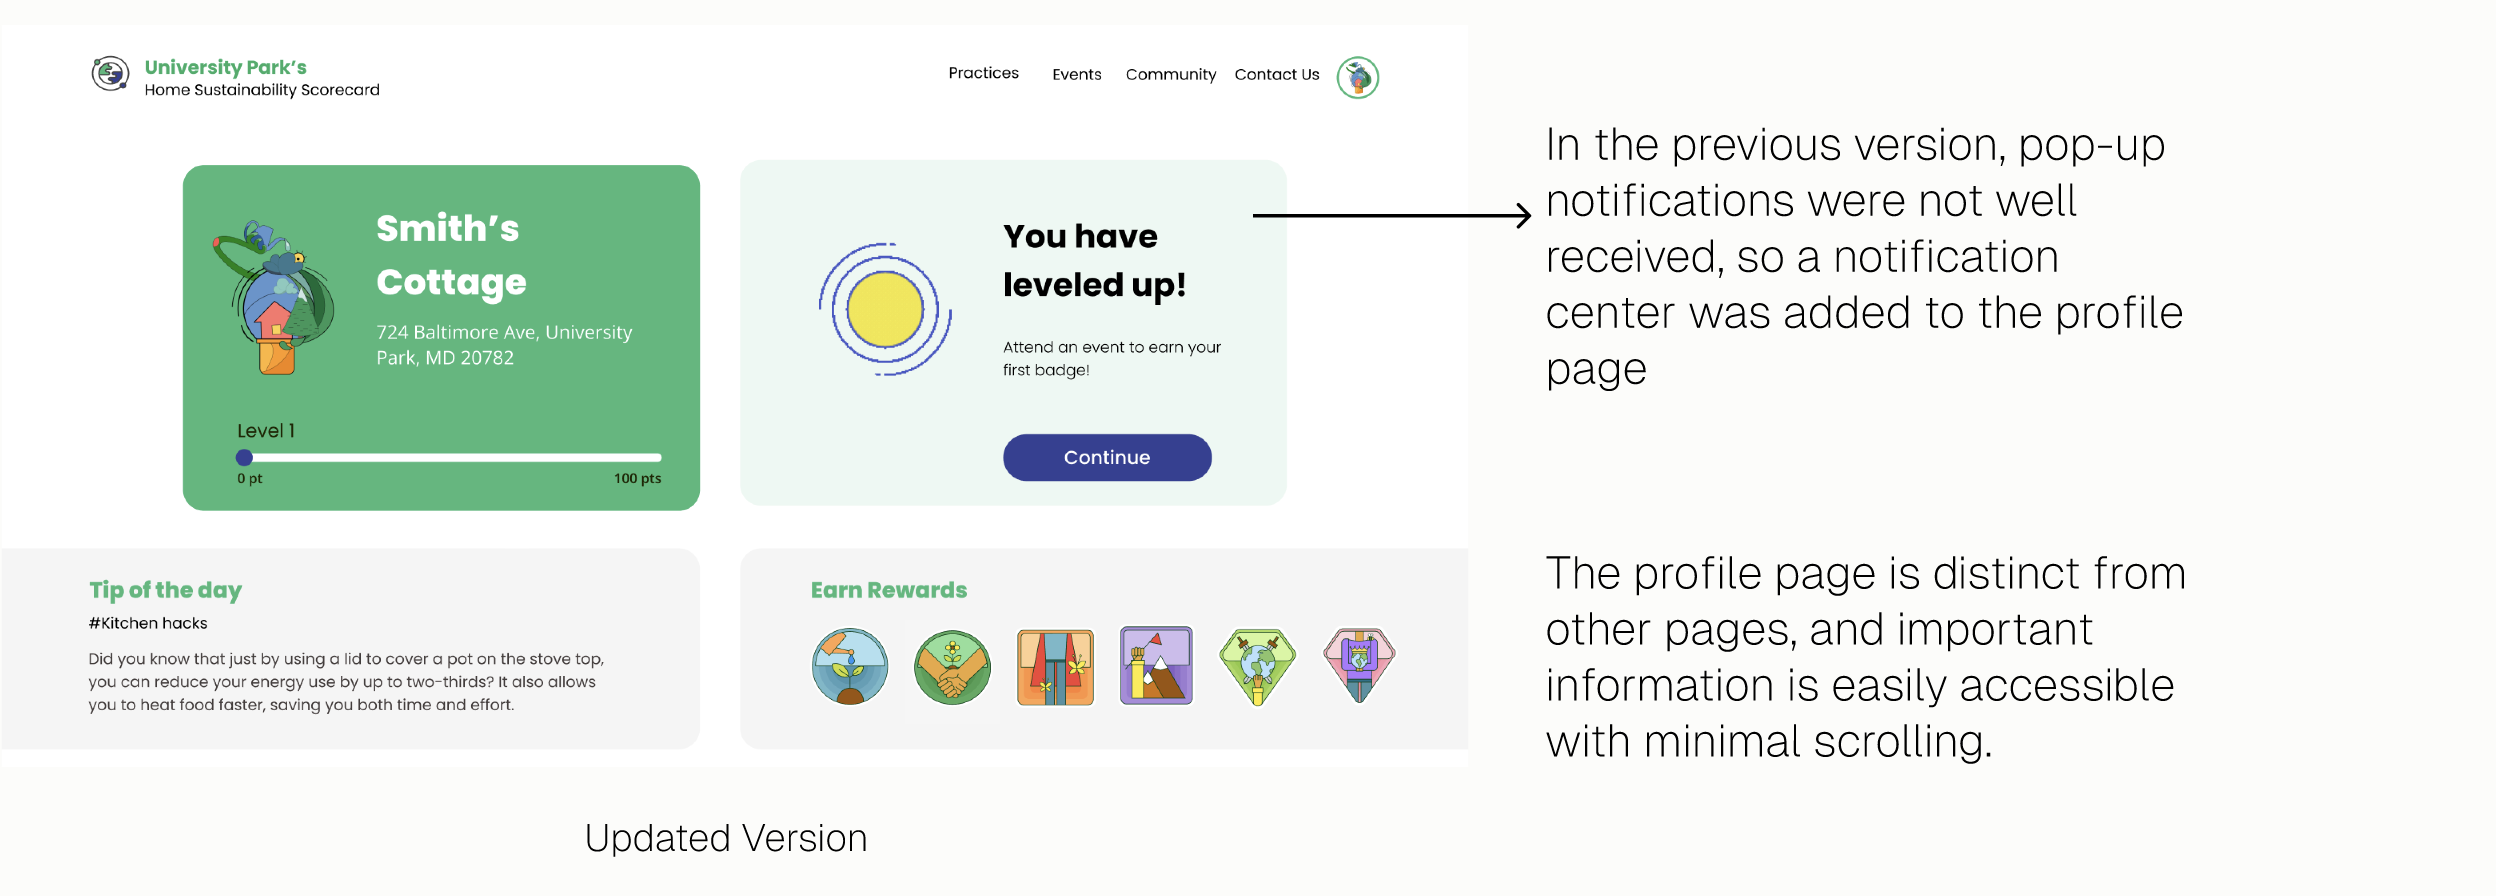
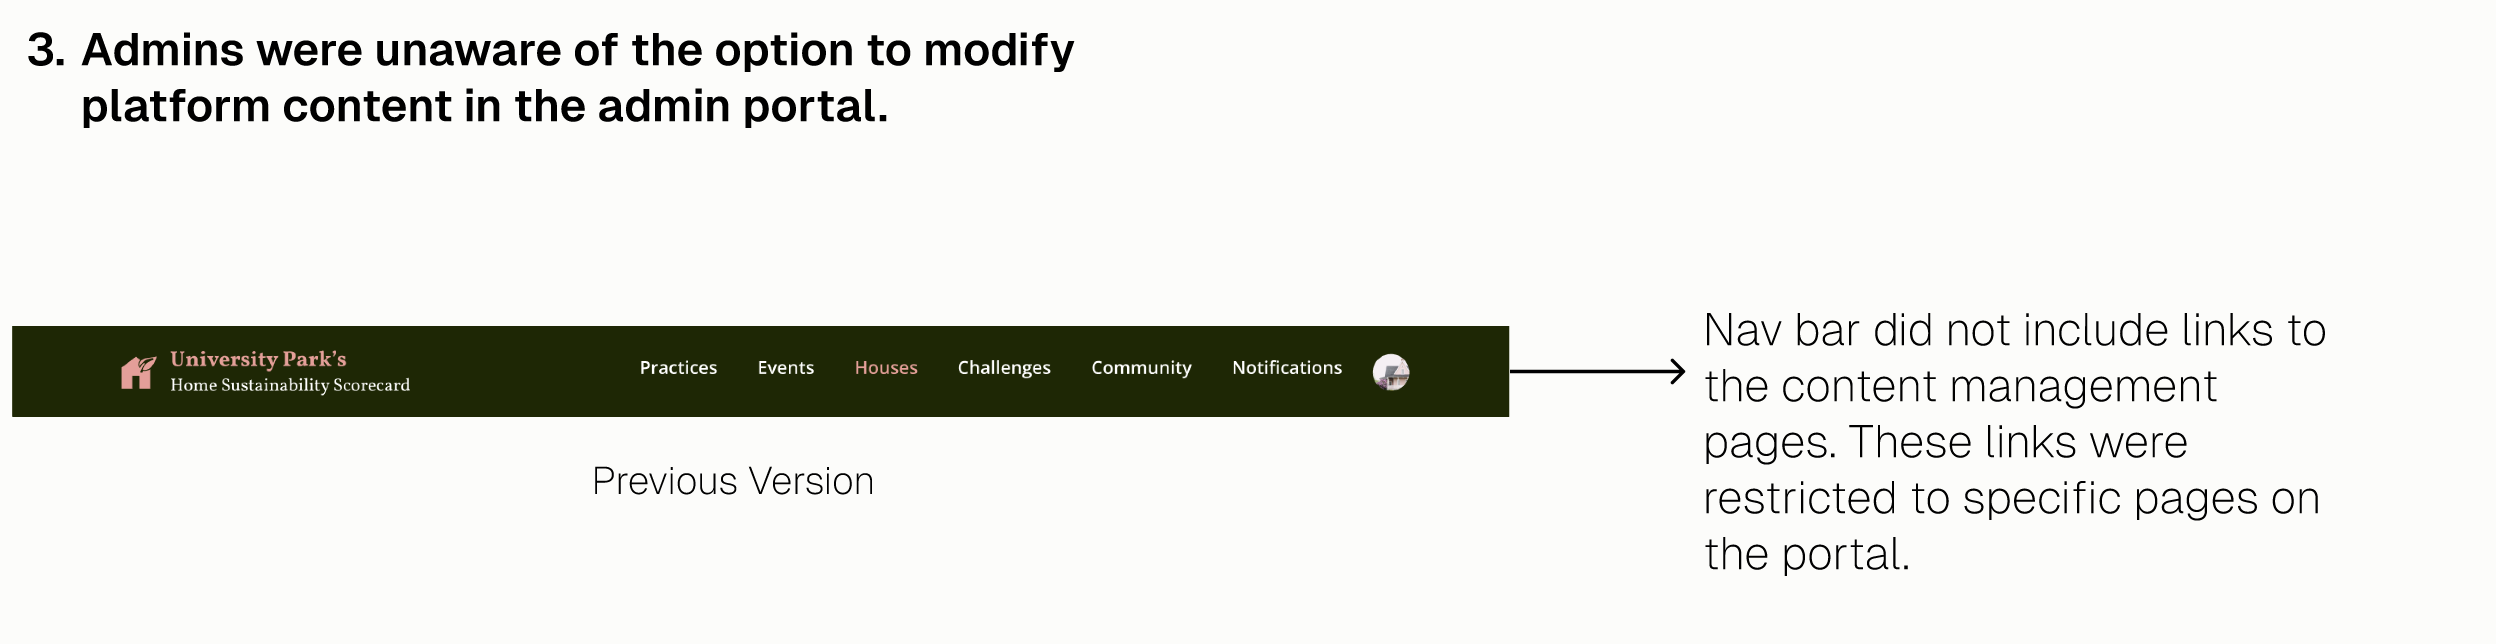
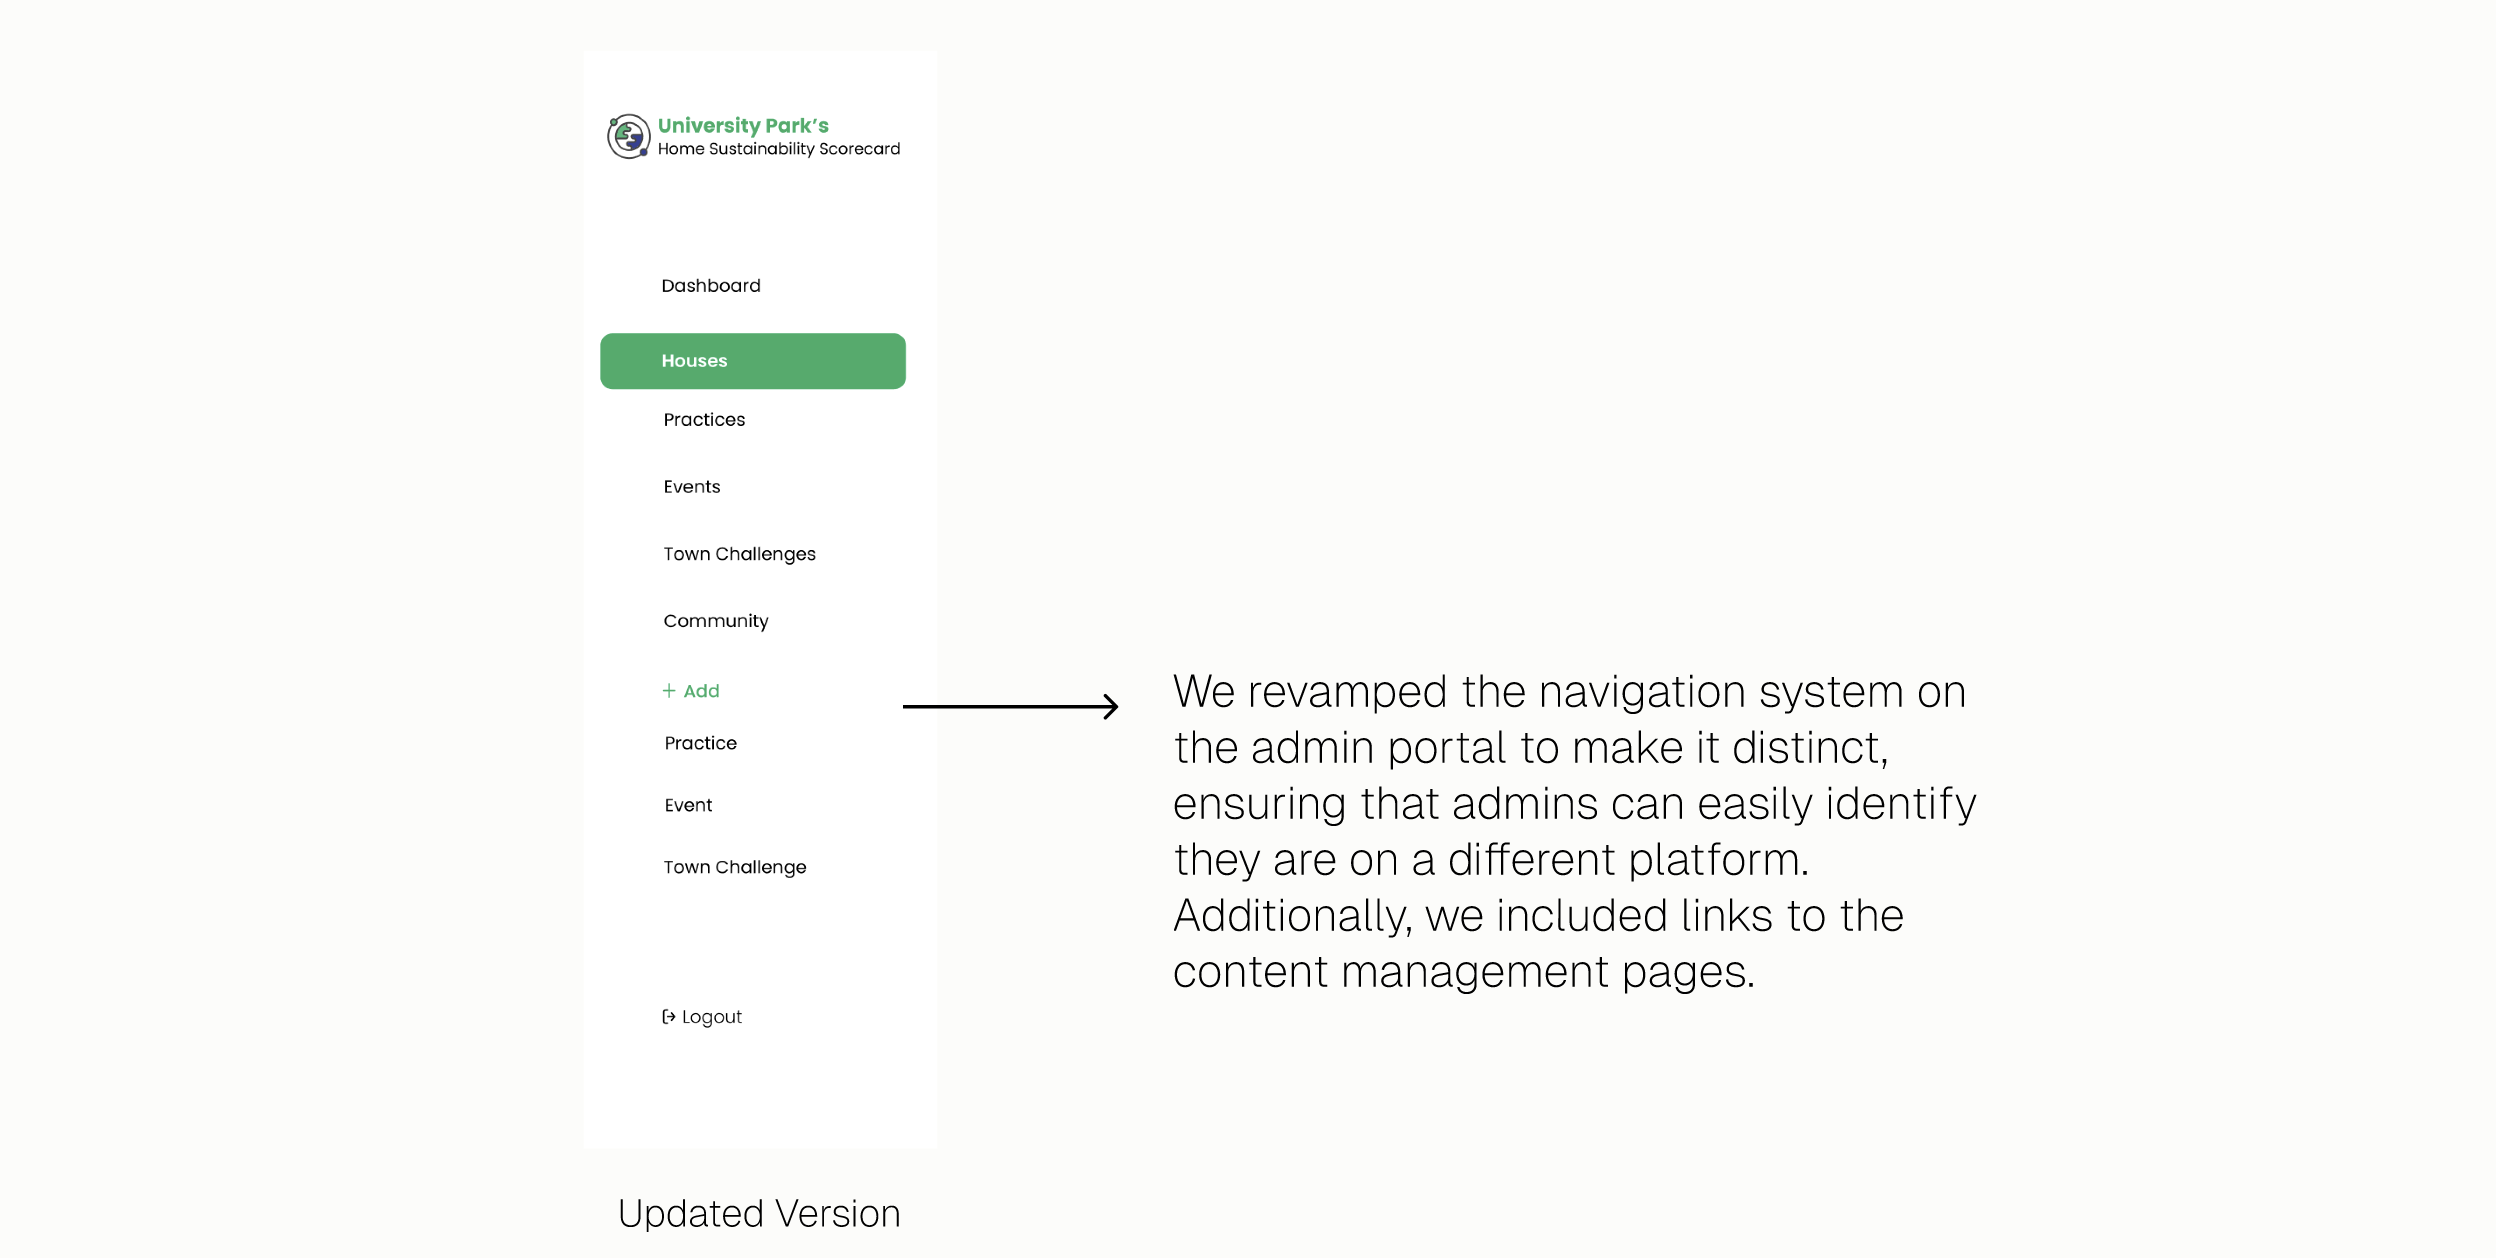
We conducted remote semi-structured user interviews with University Park residents of varying demographics, guided by a task list focused on the five main user flows we identified.

Here’s what we gathered:
After addressing user feedback and designing all user flows, the design files were thoroughly documented in Figma Dev mode for developer handoff.

Key Takeaways

  • Sometimes the best idea is the one you don't build. We walked away from a fully gamified concept with individual profiles and household leaderboards because the complexity wasn't earning anything for the user.
  • The information architecture was the design. Once we understood how the data needed to move through the system, most of the visual decisions made themselves.
Credits
  • Aaditya, Fatema, Meghana and Pooja for being incredible teammates.
  • Joe Thompson and the entire University Park Sustainability Committee for this meaningful opportunity.
  • Dr. Lutters for his insightful guidance.